Canada’s Pipeline Transportation System 2016
Nova Gas Transmission Ltd. (NGTL)
| Commodity and NEB Group | Natural Gas (Group 1) |
||
| Location | Upstream James River | North and East | Eastern Gate |
| Primary receipt points | Northwestern Alberta and Northeastern BC | North and East Alberta | Intra-Alberta |
| Primary delivery points | Intra-Alberta and the AB/BC border | Intra-Alberta | McNeill, Empress |
| Annual average capacity | 228 106m³/d (8.0 Bcf/d) |
121 106m³/d (4.3 Bcf/d) |
126 106m³/d (4.5 Bcf/d)Note a |
| Average utilization 2015 | 97% | 72% | 98%Note b |
| Total system delivery volume 2015 | 111.2 109m³ (3.9 Tcf) |
||
| Rate base 2015 | $6.1 billion | ||
| Cost of Service 2015 | $1.8 billion | ||
| Abandonment Cost Estimate and Collection PeriodNote c | $2.184 billion; 30 years |
||
Overview
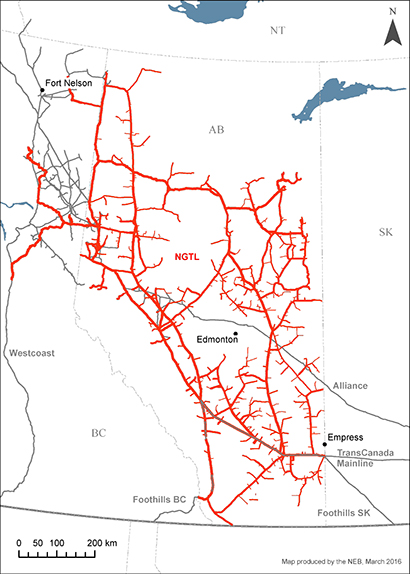
The Nova Gas Transmission Ltd. system (NGTL) consists of more than 25 000 km of natural gas pipeline and associated facilities located in Alberta and northeastern B.C. NGTL has over 1 100 receipt points and over 300 delivery points. The system came under NEB jurisdiction in 2009 and is wholly-owned by TransCanada Corporation.
NGTL is divided into three areas: Peace River, North and East, and the NGTL Mainline. Throughput information is provided for these areas as Upstream James River, North and East Flows, and Eastern Gate, respectively.
Key Developments
NGTL is expanding at a rapid pace, adding more than $2 billion in facilities between 2010 and 2015. New supply has entered the system, particularly from the Montney formation in the northwest portion of the system. Capacity is constrained in some parts of these rapidly growing areas and NGTL is adding additional facilities.
Source: NEB
Text version of this map
This map provides an overview of the NOVA Gas Transmission system.
Utilization
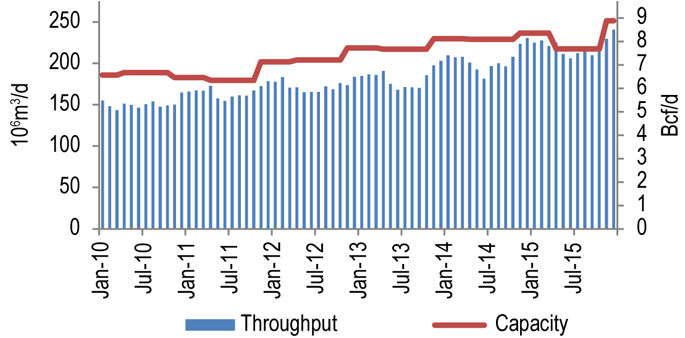
Natural gas from receipt points in northwestern Alberta and northeastern B.C. enters NGTL upstream of James River via the Horn River and Groundbirch pipelines. Figure 10.1.1 shows throughput and capacity for Upstream James River. Capacity was approximately 184 106m³/d (6.5 Bcf/d) in 2011 and has increased to 251 106m³/d (8.9 Bcf/d) at the end of 2015. Throughput has increased on this section of the system with growing supply from the Horn River and Montney formations. Throughput averaged 220 106m³/d (7.78 Bcf/d) in 2015.
Figure 10.1.1: NGTL Upstream James River Throughput vs. Capacity
Sources: TransCanada, NEB
Text version of this graphic
This bar chart shows throughput and capacity for the Upstream James River segment of the NGTL System between 2010 and 2015. Capacity in 2015 was 228 106m³/d (8.0 Bcf/d). Throughput averaged 220 106m³/d (7.78 Bcf/d) in 2015, compared to 205 106m³/d (7.24 Bcf/d) in 2014.
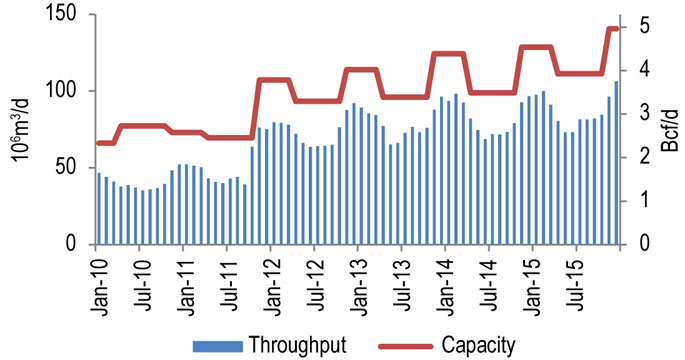
Flows on the North and East areas of NGTL consist of intra-Alberta flows, including natural gas used for oil sands operations in northern Alberta. Figure 10.1.2 shows throughput and capacity for North and East. Capacity varies seasonally and has been increasing since 2010. In 2015, capacity ranged from 111 106m³/d (3.9 Bcf/d) in summer to 141 106m³/d (5.0 Bcf/d) in winter. Throughput averaged 87 106m³/d (3.08 Bcf/d) in 2015.
Figure 10.1.2: NGTL North and East Throughput vs. Capacity
Sources: TrancCanada, NEB
Text version of this graphic
This bar chart shows throughput and capacity for the North and East segment of the NGTL System between 2010 and 2015. Capacity in 2015 was 121 106m³/d (4.3 Bcf/d). Throughput averaged 87 106m³/d (3.08 Bcf/d) in 2015, compared to 83 106m³/d (2.93 Bcf/d) in 2014.
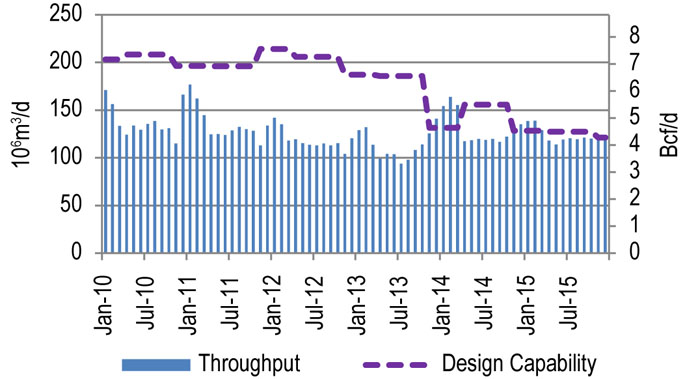
Figure 10.1.3 shows the design capability and throughput at the Eastern Gate, where NGTL interconnects with TransCanada’s Mainline at Empress and Foothills Saskatchewan at McNeill, near the Alberta-Saskatchewan border. Design capability is based on the methodology which states that the maximum day deliveries will not exceed the lesser of the capability of the downstream pipeline or the aggregate of the applicable firm contract demand.
Figure 10.1.3: NGTL Eastern Gate Throughput vs. Design Capability
Sources: TransCanada, NEB
Text version of this graphic
This bar chart shows throughput and capacity for the Eastern Gate segment of the NGTL System between 2010 and 2015. Design capability in 2015 was 126 106m³/d (4.5 Bcf/d). Throughput averaged 124 106m³/d (4.38 Bcf/d) in 2015, compared to 131 106m³/d (4.62 Bcf/d) in 2014.
In recent years the aggregate contract demand quantities of the firm transportation service agreements have determined NGTL’s design capability at the Eastern Gate. With the decline in contract demand quantities at the Eastern Gate, NGTL’s design capability and capacity in place has declined. In 2015 throughput at the Eastern Gate averaged 124 106m³/d (4.4 Bcf/d). Design capability has been declining as supply shifts farther from the Eastern Gate and intra-NGTL System deliveries increase. The design capability includes assumptions relating to storage levels, ambient air and ground temperatures, flow distribution, and local supply and deliveries. Throughput may exceed the design capability when actual conditions are different from the design assumptions.
Tolls
NGTL operated under revenue requirement settlements for 2010-2015.
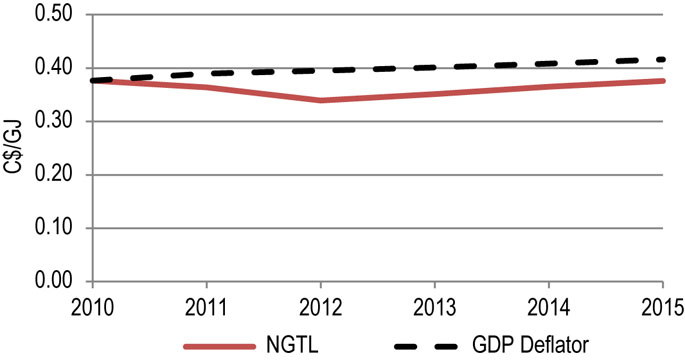
Figure 10.1.4 shows the NGTL benchmark tollNote 1 (firm receipt toll, plus delivery toll to Group 1 locations) and the GDP deflator (normalized) for 2010-2015. The benchmark toll declined in 2011 and 2012 with higher throughput and increased in line with the GDP deflator from 2012 through 2015 as system costs and throughput both increased.
Figure 10.1.4: NGTL Benchmark Toll
Source: NEB
Text version of this graphic
This graph shows the NGTL benchmark toll as a solid red line and the GDP deflator as a black dashed line. The benchmark toll decreased from $0.38 in 2010 to a low of $0.34 in 2012 and was back up to $0.38 in 2015.
Financial
NGTL’s revenue, net income and rate base have been growing due to system expansions and increased throughput. NGTL’s financial ratios have remained stable and its credit ratings remain investment grade.
| Nova Gas Transmission Ltd. | 2010 | 2011 | 2012 | 2013 | 2014 | 2015 |
|---|---|---|---|---|---|---|
| Revenues (millions) | $1 117.1 | $1 200.2 | $1 354.4 | $1 506.4 | $1 614.4 | $1 767.1 |
| Net Income (millions) | $194.1 | $195.6 | $198.1 | $232.0 | $228.5 | $245.3 |
| Rate Base (millions) | $4 834.2 | $4 878.1 | $5 177.6 | $5 670.7 | $5 917.2 | $6 094.1 |
| Deemed Equity Ratio | 40% | 40% | 40% | 40% | 40% | 40% |
| Return on Equity | 10.04% | 10.03% | 9.57% | 10.23% | 9.65% | 9.65% |
| Interest and Fixed Charges Coverage RatioNote a | 2.18 | 2.16 | 2.1 | 2.34 | 2.19 | 2.11 |
| Cash Flow to Total Debt and Equivalents RatioNote a | 14.3% | 13.5% | 12.6% | 13.6% | 12.6% | 12.3% |
| DBRS Credit Rating | A | A | A | A (low) | A (low) | A (low) |
| S&P Credit Rating | A- | A- | A- | A- | A- | A- |
| Moody’s Credit Rating | A3 | A3 | A3 | A3 | A3 | A3 |

- Date modified: