Canada’s Pipeline Transportation System 2016
Westcoast Energy Inc.’s Westcoast Transmission System
| Commodity and NEB Group | Natural Gas (Group 1) |
| Average annual capacity (T-South) | 44 106m³/d (1.6 Bcf/d) |
| Average utilization 2015 | 92% |
| Primary receipt points | T-North |
| Primary delivery points | Lower Mainland, Huntingdon, BC |
| Rate base 2015 | $1.3 billion |
| Cost of Service 2014 | $377 million |
| Abandonment Cost Estimate and Collection PeriodNote a | $684 million; 40 years |
Overview
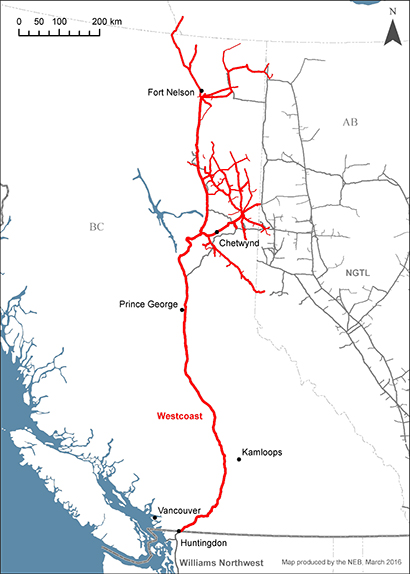
Westcoast Energy Inc., carrying on business as Spectra Energy Transmission, owns the Westcoast Transmission System (Westcoast). Westcoast extends from points in Yukon, the Northwest Territories, Alberta and BC, to the Canada-U.S. border near Huntingdon, BC. At the border Westcoast connects to Williams Northwest Pipeline, which supplies natural gas to the U.S. Pacific Northwest. Westcoast’s transmission system is composed of two parts: T-North which is north of Station 2 just west of Chetwynd (deliveries to NGTL and T-South) and T-South south of Station 2 (deliveries to BC Lower Mainland and the Huntingdon export point). T-North connects to NGTL at two points: Nova Gordondale and Sunset/Groundbirch. Westcoast’s gathering and processing system, which is regulated by the Board under the Framework for Light-handed Regulation, is also shown on the map.
Source: NEB
Text version of this map
This map provides an overview of the Westcoast Energy system Throughout Northeast B.C. and down to Huntingdon.
Key Developments
Westcoast submitted two applications to the Board that would provide additional firm service in the Peace River area of BC. The Jackfish Lake Expansion Project was approved by the Board on 15 July 2016. The High Pine Expansion is still before the Board.
Utilization
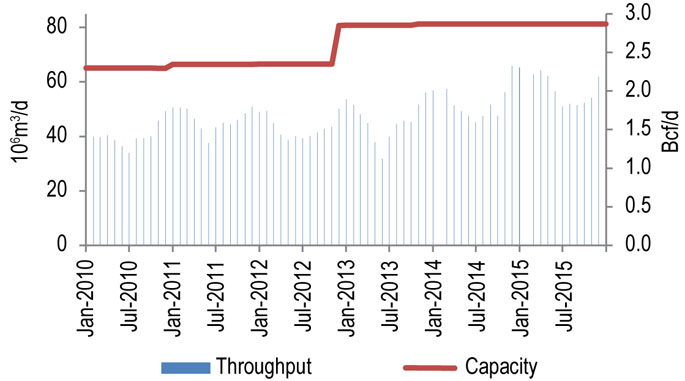
Figure 10.5.1 shows throughput and capacity for T-North for 2010-2015. In 2015, capacity averaged 81 106m³/d (2.9 Bcf/d) and throughputs averaged 58 106m³/d (2.1 Bcf/d). Deliveries from Westcoast to NGTL averaged 14 106m³/d (0.5 Bcf/d) in 2015.
Figure 10.5.1: Westcoast T-North Throughput vs. Capacity
Sources: Westcoast, NEB
Text version of this graphic
This bar chart shows throughput and capacity on the T-North segment of the Westcoast system between 2010 and 2015. Capacity in 2015 was 81 106m³/d (2.9 Bcf/d). Throughput averaged 58 106m³/d (2.1 Bcf/d) in 2015, compared to 53.5 106m³/d (1 89 Bcf/d) in 2014.
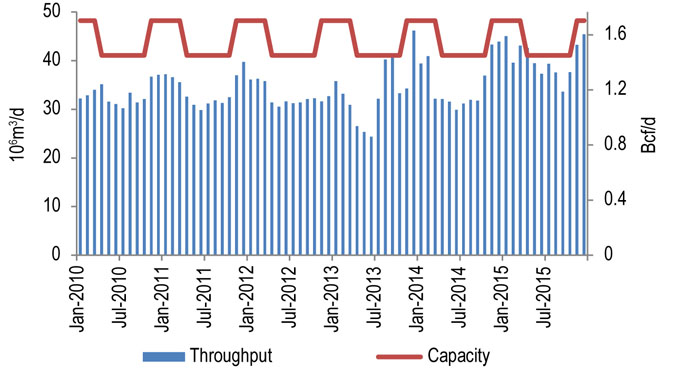
Figure 10.5.2 shows throughput and capacity on Westcoast’s T-South Segment for 2010-2015. In 2015, capacity fluctuated between 41 106m³/d (1.45 Bcf/d) and 48 106m³/d (1.70 Bcf/d), and throughput averaged 40 106m³/d (1.4 Bcf/d). Throughputs at the Huntingdon export point averaged 31 106m³/d (1.08 Bcf/d) in 2015.
Figure 10.5.2: Westcoast T-South Throughput vs. Capacity
Sources: Westcoast, NEB
Text version of this graphic
This bar chart shows throughput and capacity on the T-South segment of the Westcoast system between 2010 and 2015. Capacity in 2015 was 44 106m³/d (1.6 Bcf/d). Throughput averaged 40 106m³/d (1.4 Bcf/d) in 2015, compared to 35 106m³/d (1.2 Bcf/d) in 2014.
Tolls
Westcoast transmission services are tolled according to the terms of a negotiated settlement, which uses a cost of service framework. Westcoast operated under toll settlements from 2011 to 2015.
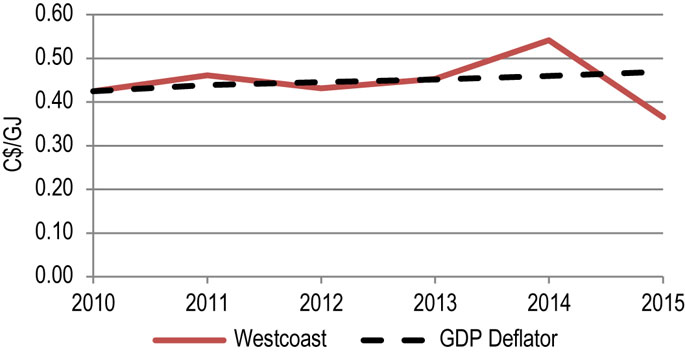
Figure 10.5.3 shows the Westcoast benchmark tollFootnote 1 (Firm Transportation Service – T-South, 2-year contract delivered to the Huntingdon Delivery Area) and the GDP deflator (normalized) for 2010-2015. The benchmark toll moved in line with the GDP deflator from 2010 to 2013 and increased in 2014 due to forecasts of lower throughput and costs associated with added facilities such as its North Montney project and the T-North Expansion. Actual throughput was higher than expected in 2014 so the extra revenue was applied to tolls in 2015. Along with higher forecast throughput for 2015, this resulted in lower tolls in 2015.
Figure 10.5.3: Westcoast Benchmark Toll
Sources: NEB toll filings and NEB calculations
Text version of this graphic
This graph shows the Westcoast benchmark toll as a solid red line and the GDP deflator as a black dashed line. The benchmark toll was aligned with the GDP deflator from 2010 through 2013. It increased to $0.54 in 2014 and decreased to $0.37 in 2015.
Financial
Westcoast Energy Inc.’s revenue, net income, and rate base have been growing due to system expansions and increased throughput. Coverage ratios continue to be stable and credit ratings are investment grade.
| Westcoast Energy Inc. | 2010 | 2011 | 2012 | 2013 | 2014 | 2015 |
|---|---|---|---|---|---|---|
| Revenues (millions) – Westcoast Transmission | $295.7 | $322.9 | $325.0 | $396.6 | $384.8 | $393.8 |
| Net Income (millions) – Westcoast Transmission | $35.1 | $46.1 | $49.6 | $53.1 | $53.9 | $50.6 |
| Rate Base (millions) – Westcoast Transmission | $1 092.9 | $1 074.3 | $1 223.9 | $1 349.1 | $1 346.4 | $1 346.9 |
| Deemed Equity Ratio – Westcoast Transmission | 36% | 40% | 40% | 40% | 40% | 40% |
| Achieved Return on Equity – Westcoast Transmission | 8.78% | 10.01% | 9.36% | 9.54% | 9.89% | 9.01% |
| Interest and Fixed-Charges Coverage RatioNote a | 2.31 | 2.52 | 1.96 | 2.21 | 2.17 | 3.46 |
| Cash Flow to Total Debt and Equivalents RatioNote a | 17.2% | 15.4% | 13.7% | 15.1% | 16.0% | 20.3% |
| DBRS Credit RatingNote b | A (low) | A (low) | A (low) | A (low) | A (low) | A (low) |
| S&P Credit RatingNote b | A- | BBB+ | BBB+ | BBB | BBB | BBB |

- Date modified: