Provincial and Territorial Energy Profiles – Quebec
Update in progress
An update to these profiles will launch in Spring 2024. For current data and information, please visit:
- Canada's Energy Future data appendices tool
- Environment and Climate Change Canada's GHG Emissions Inventory

Connect/Contact Us
Please send comments, questions, or suggestions to
energy-energie@cer-rec.gc.ca
Table of Contents
-
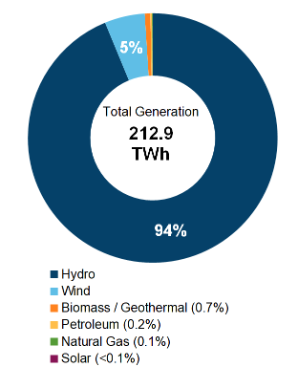
Figure 1: Electricity Generation by Fuel Type (2019)
Source and Description:
Source:
CER – Canada's Energy Future 2021 Data AppendicesDescription:
This pie chart shows electricity generation by source in Quebec. A total of 212.9 TW.h of electricity was generated in 2019. -
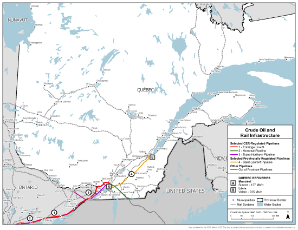
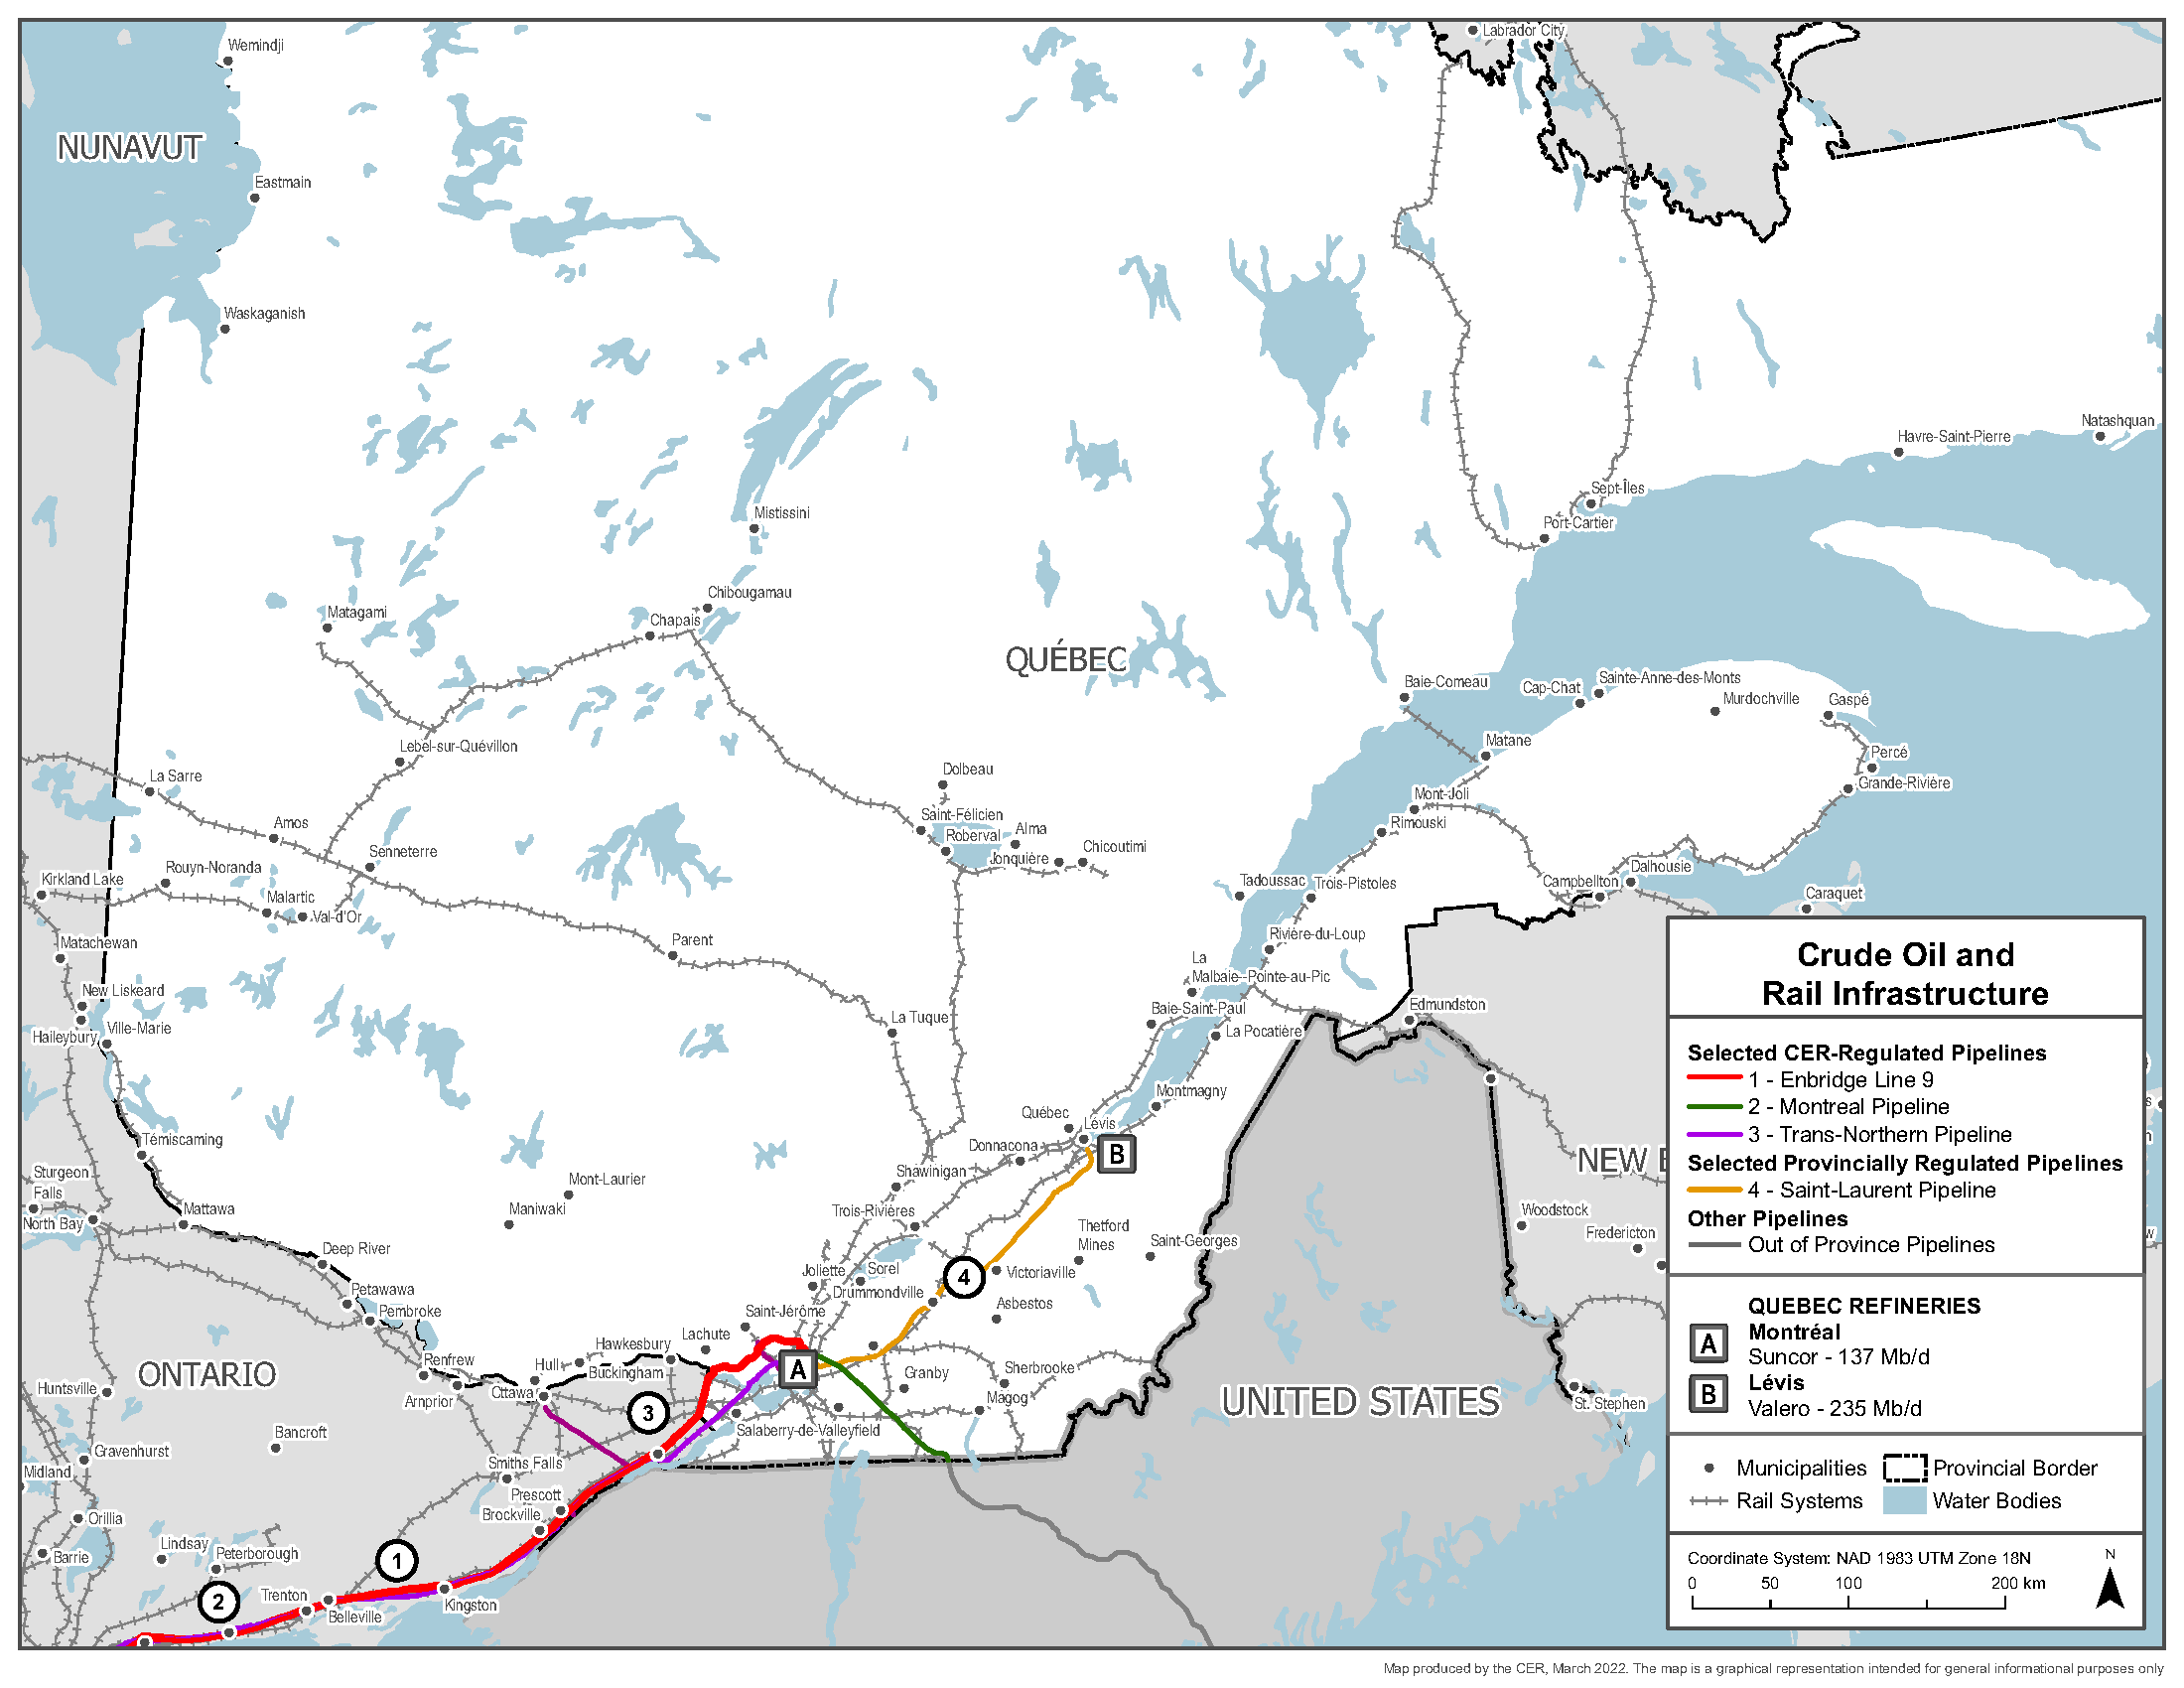
Figure 2: Crude Oil Infrastructure Map
Source and Description:
Source:
CERDescription:
This map shows all major crude oil pipelines, rail lines, and refineries in Quebec.Download:
PDF version [1 261 KB] -
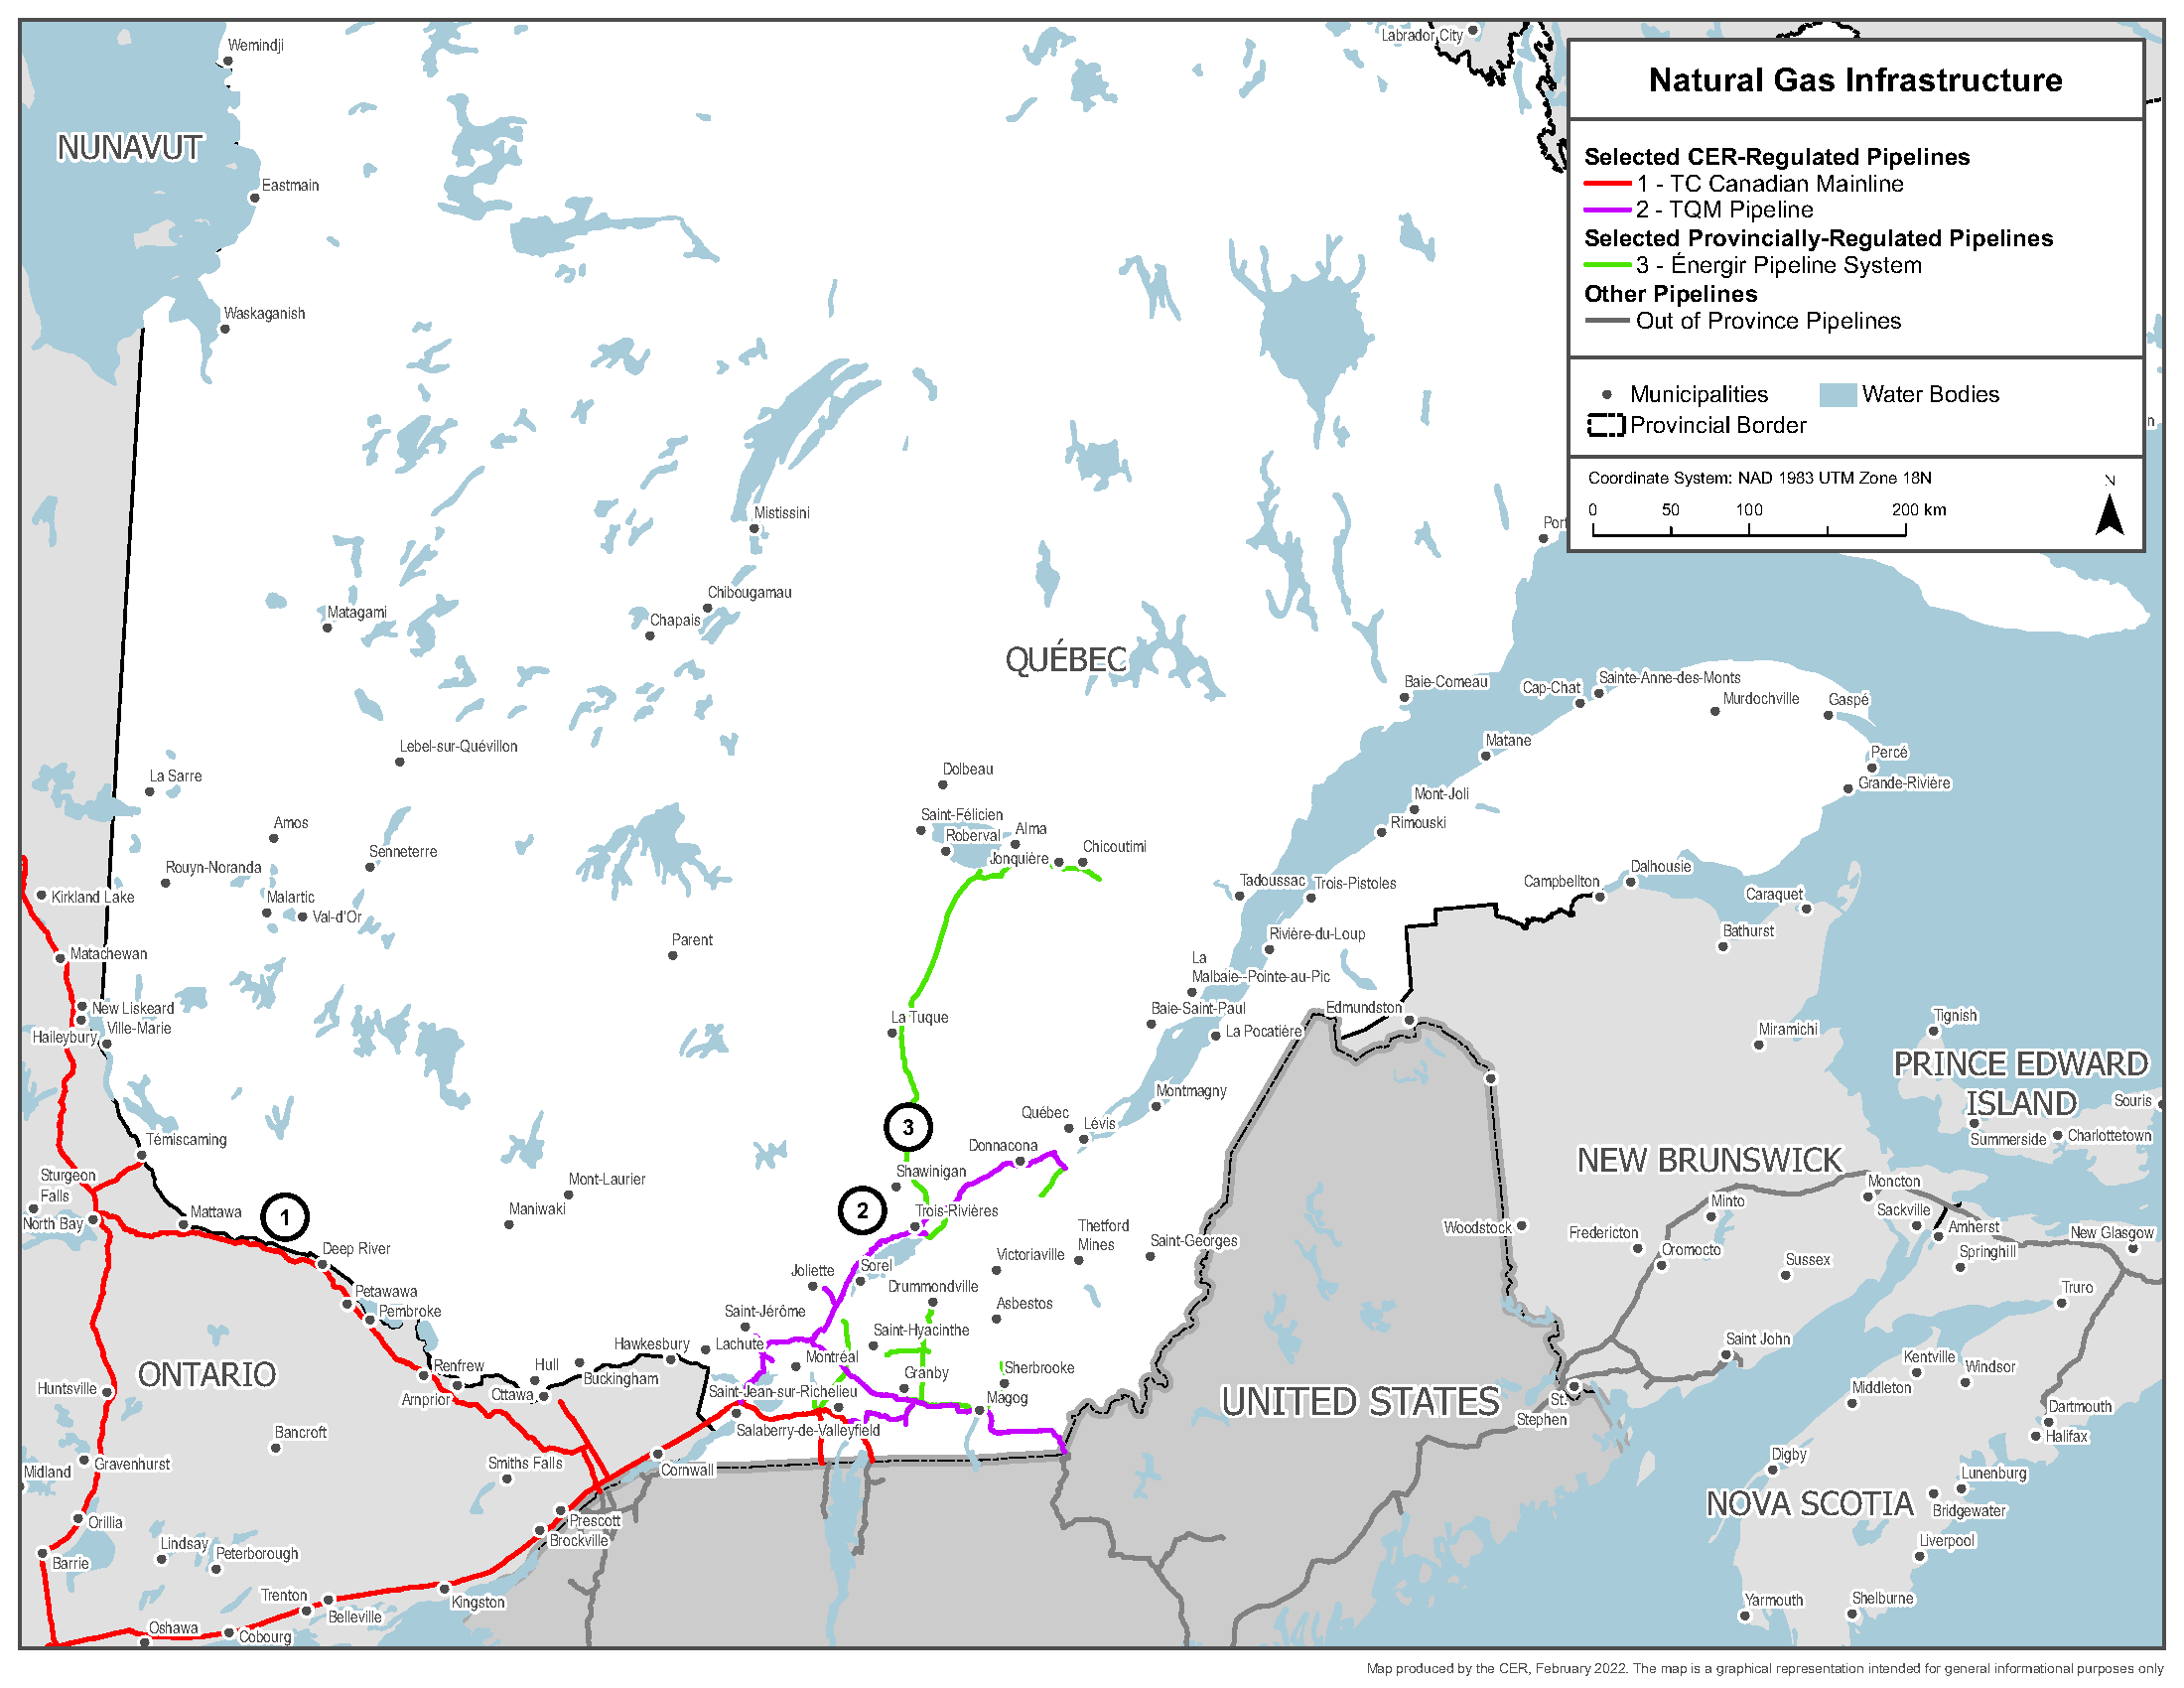
Figure 3: Natural Gas Infrastructure Map

Source and Description:
Source:
CERDescription:
This map shows all major natural gas pipelines in Quebec.Download:
PDF version [1 353 KB] -
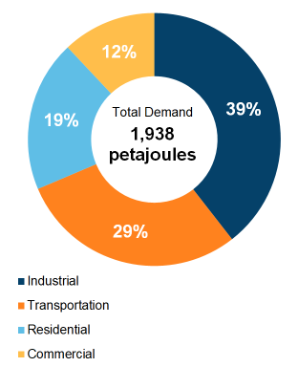
Figure 4: End-Use Demand by Sector (2019)
Source and Description:
Source:
CER – Canada's Energy Future 2021 Data AppendicesDescription:
This pie chart shows end-use energy demand in Quebec by sector. Total end-use energy demand was 1 938 PJ in 2018. The largest sector was industrial at 39% of total demand, followed by transportation (at 29%), residential (at 19%), and lastly, commercial (at 12%). -
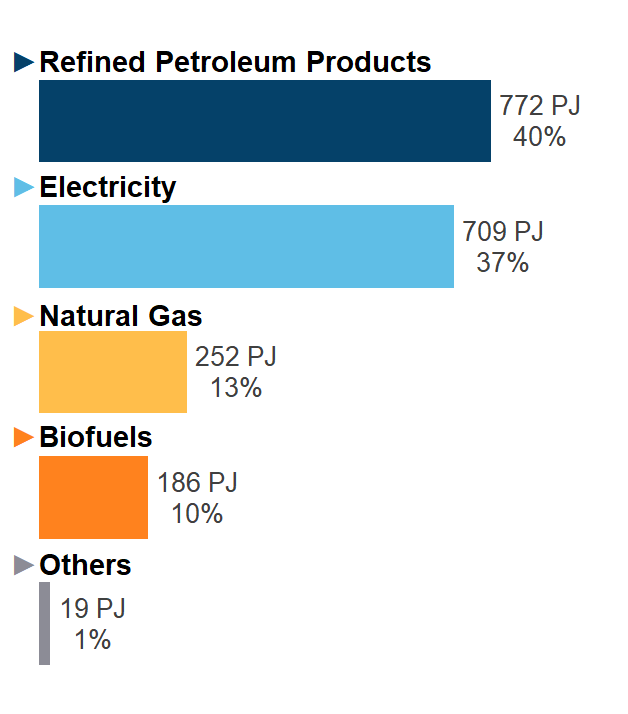
Figure 5: End-Use Demand by Fuel (2019)

Source and Description:
Source:
CER – Canada's Energy Future 2021 Data AppendicesDescription:
This figure shows end-use demand by fuel type in Quebec in 2018. Refined petroleum products accounted for 772 PJ (40%) of demand, followed by electricity at 709 PJ (37%), natural gas at 252 PJ (13%), biofuels at 186 PJ (10%), and other at 19 PJ (1%).
Note: "Other" includes coal, coke, and coke oven gas. -
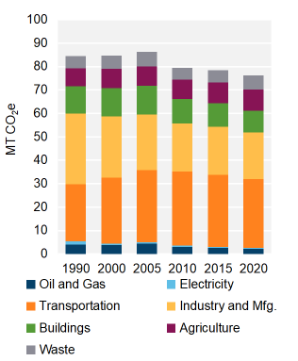
Figure 6: GHG Emissions by Sector
Source and Description:
Source:
Environment and Climate Change Canada – National Inventory ReportDescription:
This stacked column graph shows GHG emissions in Quebec by sector every five years from 1990 to 2020 in MT of CO2e. Total GHG emissions have decreased in Quebec from 84.5 MT of CO2e in 1990 to 76.2 MT of CO2e in 2020. -
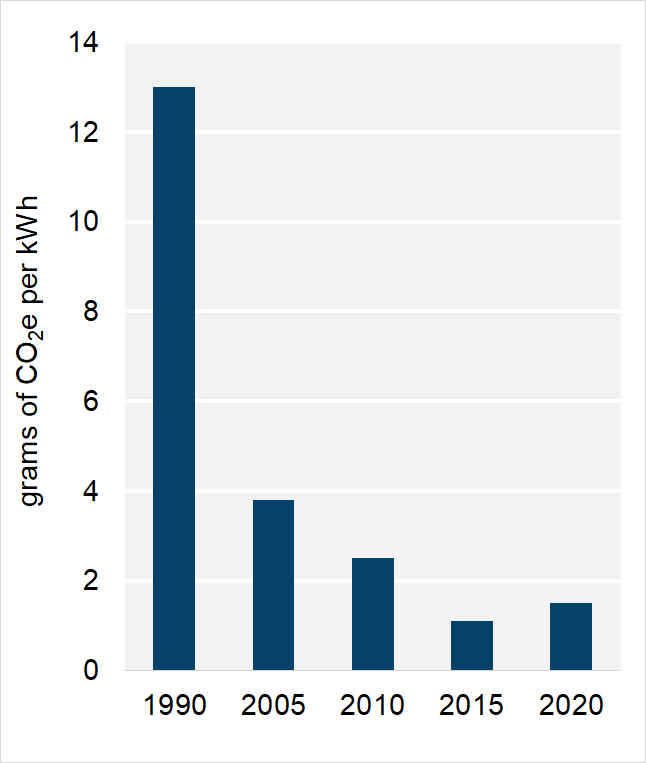
Figure 7: Emissions Intensity from Electricity Generation

Source and Description:
Source:
Environment and Climate Change Canada – National Inventory ReportDescription:
This column graph shows the emissions intensity of electricity generation in Quebec from 1990 to 2020. In 1990, electricity generated in Quebec emitted 13 g of CO2e per kWh. By 2020, emissions intensity decreased to 1.5 g of CO2e per kWh.


Energy Production
Crude Oil
- Quebec does not have any commercial crude oil production.
Refined Petroleum Products (RPPs)
- Two large refineries currently operate in Quebec with a combined capacity of 372 thousand barrels per day (Mb/d): Montreal Refinery (Suncor) in Montreal and Jean Gaulin Refinery (Valero) in Lévis, near Quebec City. Montreal Refinery has a capacity of 137 Mb/d and Jean Gaulin Refinery has a capacity of 235 Mb/d.
- Supply for Quebec’s refineries prior to 2013 was a mix of crude oil from eastern Canada and offshore imports from Africa, Europe, the Middle East, and Latin America. After 2013, use of crude oil from western Canada and the United States (U.S.) began increasing because of higher crude-by-rail deliveries, changes to pipeline infrastructure (Enbridge’s Line 9B reversal in 2015), and higher production in the U.S.
Natural Gas/Natural Gas Liquids (NGLs)
- There is no natural gas production or field production of NGLs in Quebec.
- Small volumes of propane and butane are produced by refineries in Quebec.
Renewable Natural Gas
- The City of Saint-Hyacinthe’s biomethanization project became operational in 2018 and has an annual production capacity of approximately 13 million cubic meters of renewable natural gas (RNG) per year.
- A biomethanization plant, capable of producing 2.3 million cubic metres of RNG per year, was developed by the agricultural cooperative Coop Agri-Énergie Warwick. Construction of the facility began in spring 2020, and the plant began operating in winter 2021.
- The City of Montréal has signed a contract with SUEZ to build a biomethanation plant that is expected to be commissioned in 2022 and have a capacity of roughly 4 million cubic metres of RNG.
- The Centre de biométhanisation de l’agglomération de Québec (CBAQ) is currently under construction in the City of Quebec and will have the capacity to produce 10.2 million cubic metres of RNG per year.
- Saint-Étienne-des-Grès will be built in Quebec by the Canadian subsidiary of Waga Energy and will be operational as of 2022. It will be able to produce 12.6 million cubic metres of RNG per year.
- The Montérégie Biomass Treatment Center (CTBM) will be able to produce 4.2 million cubic metres of biogas a year. After consumption on site, 2.1 million cubic metres will be available for injection into the Énergir network.
Electricity
- In 2019, Quebec generated 212.9 terawatt-hours (TWh) of electricity (Figure 1), which is about one third of total Canadian generation. Quebec is the largest producer of electricity in Canada and had an estimated generating capacity of 46 380 megawatts (MW) in 2019.
- With over 40 850 MW of installed hydroelectric capacity, hydropower generates 94% of Quebec’s electricity. This includes Canada’s largest hydro plant, the 5 616 MW Robert-Bourassa facility in northern Quebec. The facility is currently undergoing rehabilitation work that is expected to be completed in 2022.
- The Romaine hydroelectric complex is located on the Romaine River in the Côte-Nord region. It is comprised of four generating stations and has an installed capacity of 1 550 MW. Romaine-1 (270 MW), Romaine-2 (640 MW), and Romaine-3 (395 MW) are already in service. Romaine-4, with 245 MW of capacity, is currently under construction and is expected to be in operation in 2022. Wind is the second largest source of electricity generation in Quebec, contributing about 5% of total generation in 2019. Wind capacity is estimated at 4 300 MW and accounted for 9% of the province’s generating capacity in 2019.
- The Mont Sainte-Marguerite (143 MW) and the Nicolas-Riou (225 MW) wind farms were both commissioned in 2018. More recently, the Dune-du-Nord (6.4 MW), Belles-Rivières (24 MW) and Des Cultures (24 MW) wind farms were commissioned in 2020, 2021, and 2022, respectively. The 200 MW Apuiat wind farm will begin construction in 2022 with commissioning of the project scheduled for December 2024. The wind farm, a partnership between Innu communities and Boralex, will be constructed in Port-Cartier in the Côte-Nord region.
- Hydro-Québec’s Robert-A.-Boyd and Gabrielle-Bodis solar generating stations, located in Varennes and La Prairie respectively, were commissioned in June 2021. The stations have a combined capacity of 9.5 MW.
- Other sources of electricity generation include natural gas (mainly for peak winter demand), diesel (for power in remote communities), and biomass.
- Hydro-Québec generates most of the electricity in the province, including electricity from 62 hydroelectric plants. Independent power producers operate several smaller hydroelectric plants, as well as all biomass and wind facilities.
Energy Transportation and Trade
Crude Oil and Liquids
- Quebec receives crude oil by Enbridge’s Line 9, by rail, and by tanker (Figure 2). Quebec can also receive crude oil via the Portland-Montreal Pipeline, but throughputs on the pipeline have been very low since 2016.
- Line 9 has been delivering crude oil from Sarnia, Ontario, to Montreal since its reversal became operational in December 2015. The line has a capacity of 300 Mb/d and transports a combination of oil from western Canada and the U.S. Midwest.
- In 2021, deliveries of crude oil on the Portland-Montreal Pipeline averaged 6.5 Mb/d, or 3% of the pipeline’s capacity.
- There are three rail terminals in Quebec capable of receiving crude oil, including one at each of the Suncor and Valero refineries, and one in Sorel-Tracy. These facilities have a combined capacity to receive approximately 123 Mb/d of crude oil.
- Quebec also receives crude oil via tankers arriving at Montreal and Lévis.
- The Trans-Northern Pipeline delivered approximately 124 Mb/d of RPPs in 2020, including gasoline, diesel, aviation fuel, and heating fuel from Montreal to markets in Ontario.
- Valero’s Saint-Laurent Pipeline has a capacity of 100 Mb/d and delivers RPPs from the Valero refinery in Lévis to a distribution terminal in east Montreal.
Natural Gas
- The Trans-Quebec and Maritimes (TQM) pipeline connects to TC Energy’s Canadian Mainline near Saint Lazare, close to the Ontario border. TQM transports natural gas for use in Quebec as well as for export through an interconnection with the Portland Natural Gas Transmission System at East Hereford. (Figure 3)
- Historically, Quebec was a consumer of western Canadian natural gas. More recently, growing gas production in the U.S., reversal of export points in Ontario, and additional interconnects between Ontario and Quebec have enabled higher deliveries of U.S. gas into Quebec.
- Énergir (formerly Gaz Métro) distributes gas to approximately 300 municipalities on over 10 000 kilometres (km) of pipelines. Enbridge Gazifère operates 987 km of pipelines and serves the Outaouais region. Energir and Gazifère are provincially regulated by Quebec’s Régie de l’énergie.
Liquefied Natural Gas (LNG)
- Énergir has operated a liquefaction, storage, and regasification plant east of Montreal since 1971. Énergir expanded the plant’s capacity in 2017 to help meet growing demand for LNG by the road and marine transportation sectors, as well as for regions not connected to the natural gas grid.
- In 2015, the NEB (now CER) approved a 25-year export licence [Folder 2587030] for Stolt LNGaz for volumes of up to 80 MMcf/d. The project has also received provincial government approvals. A final investment decision has not yet been made on the project, which includes a proposed liquefaction terminal near Bécancour. As of 2022, the project has not progressed and is up for sale.
- In 2016, the NEB approved a 25-year export licence [Filing A72342] for GNL Quebec for its proposed Énergie Saguenay LNG export facility. The project was scheduled to be operational in 2026, but was rejected by the province of Quebec in 2021 because of financial and environmental concerns. The Impact Assessment Agency of Canada (IAAC) also denied the project in 2022 citing adverse environmental effects.
Electricity
- In 2019, Quebec’s net electricity interprovincial and international outflows were 3.4 TWh.
- Under long-term contracts, Hydro-Québec can access most of the output of the 5 428 MW Churchill Falls hydroelectric station in Labrador until 2041.
- Quebec also trades with electricity markets in the U.S. Northeast, primarily New England and New York. In 2019, Quebec was the largest exporter of electricity to the U.S. of all Canadian provinces, with gross exports totalling 25.9 TWh.
- Hydro-Québec operates 34 802 km of transmission lines and 225 304 km of distribution lines. Fifteen interconnections link Quebec’s electricity system with systems in Ontario, New Brunswick, and the U.S. Northeast.
- The proposed Appalaches-Maine Interconnection Project would increase the electricity exchange capacity between Quebec and New England through 100 km of new 320-kilovolt direct-current electricity lines. The project received government and CER approvals in 2021 and commissioning of the line is scheduled for 2023. The project faces uncertainty, as it would connect to the New England Clean Energy Connect LLC’s corridor project, which was voted down in a Maine referendum.
Energy Consumption and Greenhouse Gas (GHG) Emissions
Total Energy Consumption
- End-use demand in Quebec was 1 975 petajoules (PJ) in 2019. The largest sector for energy demand was industrial at 40% of total demand, followed by transportation at 29%, residential at 19%, and commercial at 12% (Figure 5). Quebec’s total energy demand was the third largest in Canada, and the eighth largest on a per capita basis.
- RPPs were the largest fuel type consumed in Quebec, accounting for 782 PJ, or 40% of total end-use demand. Electricity and natural gas accounted for 733 PJ (37%) and 253 PJ (13%), respectively (Figure 6).
Refined Petroleum Products
- Quebec’s motor gasoline demand in 2019 was 1 114 litres per capita, 12% below the national average of 1 268 litres per capita.
- Quebec’s diesel demand in 2019 was 574 litres per capita, 33% below the national average of 855 litres per capita.
- Most of the gasoline consumed in Quebec is refined in the province. However, some gasoline is imported from the U.S. East Coast and Europe or is transferred from the Maritimes.
Natural Gas
- In 2020, Quebec consumed an average of 587 million cubic feet per day (MMcf/d) of natural gas. Quebec’s demand represented 5% of total Canadian demand.
- Quebec’s largest consuming sector for natural gas was the industrial sector, which consumed 366 MMcf/d in 2020. The commercial and residential sectors consumed 157 MMcf/d and 65 MMcf/d, respectively.
Electricity
- In 2019, annual electricity consumption per capita in Quebec was 24 megawatt-hours (MWh). Quebec ranked first in Canada for per capita electricity consumption and consumed 60% more than the national average. This is largely due to the presence of some industries, such as aluminum smelters, which rely on large amounts of low-cost electricity. Most residents in Quebec also use electricity to heat their homes.
- Quebec’s largest consuming sector for electricity in 2019 was industrial at 93 TWh. The residential and commercial sectors consumed 71 TWh and 40 TWh, respectively.
GHG Emissions
- Quebec’s GHG emissions in 2020 were 76.2 megatonnes (MT) of carbon dioxide equivalent (CO2e).Footnote 1 Quebec’s emissions have declined 10% since 1990 and 12% since 2005.
- Quebec’s emissions per capita are the lowest in Canada at 8.9 tonnes CO2e – 50% below the Canadian average of 17.7 tonnes per capita.
- The largest emitting sectors in Quebec are transportation at 39% of emissions, industries and manufacturing at 26%, and buildings (residential and commercial) at 12% (Figure 7).
- Quebec’s GHG emissions from the oil and gas sector in 2020 were 2.3 MT CO2e. Of this total, 0.1 MT were attributable to transmission and 2.2 MT were attributable to petroleum refining and natural gas distribution.
- Virtually all electricity produced in Quebec comes from renewable sources. In 2020, Quebec’s power sector generated 0.4 MT CO2e emissions, which represents 0.5% of Canada’s GHG emissions from power generation.
- The greenhouse gas intensity of Quebec’s electricity grid, measured as the GHGs emitted in the generation of the province’s electric power, was 1.5 grams of CO2e per kilowatt-hour (g of CO2e/kWh) electricity generated in 2020. This is a 61% reduction from the province’s 2005 level of 3.8 g of CO2e/kWh. The national average in 2020 was 110 g of CO2e/kWh (Figure 8).
More Information
- La Régie de l’énergie du Québec
- CER–Canada's Renewable Power: Quebec
- CER–Market Snapshot: Of nearly 50 companies that export electricity, three account for more than half of all exports in 2019
- CER–Market Snapshot: Even though Canada exports a lot of electricity, it imports a lot too
- CER–Market Snapshot: Quebec’s gasoline market is one of the largest in Canada
- CER–Market Snapshot: Crypto-currency mining is booming in Canada. Here is why.
- CER–Market Snapshot: Ontario and Quebec are among the leaders in North American wind power capacity
- CER–Market Snapshot: Quebec leads Canada in zero-emission vehicle policy
- CER–Market Snapshot: U.S. gas continues to displace western Canadian gas in Quebec and Ontario
Data Sources
Provincial & Territorial Energy Profiles aligns with the CER’s latest Canada's Energy Future 2021 Data Appendices datasets. Energy Futures uses a variety of data sources, generally starting with Statistics Canada data as the foundation, and making adjustments to ensure consistency across all provinces and territories.
- Date modified: