Canada’s Pipeline Transportation System 2016
Alliance Pipeline Ltd.’s Alliance Pipeline
| Commodity and NEB Group | Liquids-Rich Natural Gas (Group 1) |
| Annual average capacity | 49 106m³/d (1.7 Bcf/d) |
| Average utilization 2015 | 99% |
| Primary receipt points | Alberta and B.C. |
| Primary delivery points | Chicago, IL |
| Rate base 2015 | $1.3 billion |
| Cost of Service 2015 | N/A |
| Abandonment Cost Estimate and Collection PeriodNote a | $310 million; 40 years |
Source: NEB
Text version of this map
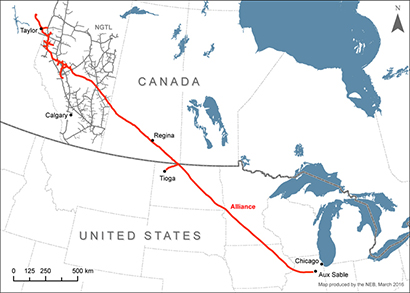
This map provides an overview of the Alliance system.
Overview
The Alliance Pipeline (Alliance) is unique among major Canadian gas pipelines because natural gas liquids may be left in the gas stream. The pipeline system draws from 52 receipt points, largely concentrated near the northern end of the system in northeastern B.C. and northwestern Alberta. Alliance transports liquids-rich gas to the Chicago market hub. Extraction of the natural gas liquids occurs at the Aux Sable facility located near Chicago.
Key Developments
Alliance began operations in 2000, supported by 15-year firm transportation contracts. In 2010, when the option to renew these contracts was triggered, few shippers opted to do so (contracts were renewed for just 8% of previously contracted capacity). Accordingly, Alliance developed its New Services Offering (NSO), which incorporated new services and tolling methodologies on the pipeline. Alliance applied for Board approval of the NSO in 2014. By the time the hearing was completed in April 2015, the pipeline was nearly fully contracted under the proposed toll framework. The Board approved the proposed firm tolls and new services, and granted Alliance some discretion in setting bid floors for seasonal firm service and interruptible service, and instructed Alliance to put any excess cash earnings into a reserve account. Alliance is to file a depreciation study for Board approval before it can make any distributions from that account.
Utilization
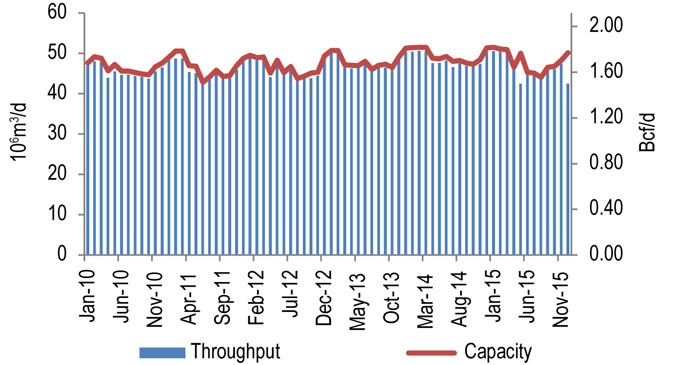
Figure 10.4.1 shows throughput and capacity on Alliance. Capacity varies with ambient temperature, from 45 106m³/d (1.6 Bcf/d) in the summer to 51 106m³/d (1.8 Bcf/d) in the winter. The pipeline has been almost fully utilized since it was put into service.
Throughput averaged 46 106m³/d (1.63 Bcf/d) in 2015.
Figure 10.4.1: Alliance Pipeline Throughput vs. Capacity
Sources: Alliance, NEB
Text version of this graphic
This bar chart shows throughput and capacity on the Alliance pipeline between 2010 and 2015. Capacity in 2015 was 49 106m³/d (1.7 Bcf/d). Throughput averaged 46 106m³/d (1.63 Bcf/d) in 2015, compared to 48 106m³/d (1.71 Bcf/d) in 2014.
Tolls
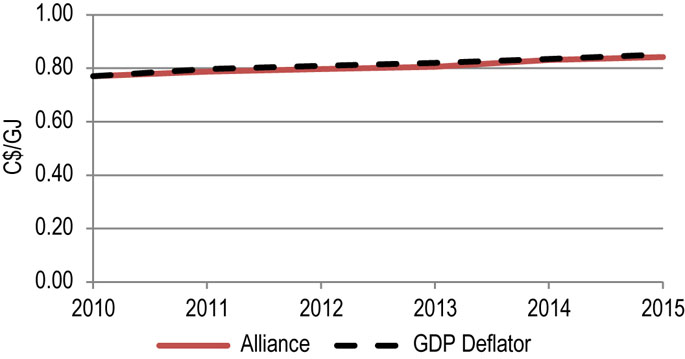
Figure 10.4.2 shows the Alliance benchmark toll and the GDP deflator (normalized) for 2010-2015. The benchmark toll was nearly flat between 2010 and 2015. The tariff included an authorized overrun service under which shippers could move an additional amount of gas at very low cost when capacity was available.
Figure 10.4.2: Alliance Benchmark Toll
Sources: NEB toll filings and NEB calculations
Text version of this graphic
This graph shows the Alliance benchmark toll as a solid red line and the GDP deflator as a black dashed line. The benchmark toll moved in line with the GDP deflator from 2010 to 2015.
Under the new toll regime, firm tolls decreased about 35% on 1 December 2015. However, shippers must pay for interruptible service if they want to move additional gas. The tollFootnote 1 dropped from $34.48/10³m³ ($0.84/GJ) to $23.61/ 10³m³ (0.58/GJ) for Zone 1 full path serviceFootnote 2.
Financial
Alliance Pipeline Ltd. (APL) has earned a return on equity of 11.26% each year since operations began. Return on equity was based on an approved baseline rate of 12.0% with an adjustment for cost overruns during construction. In December 2015, APL began operating under its NSO, and will report achieved return on equity in annual compliance filings to the Board. In addition, it is required to file other information with the Board on a quarterly basis. This information was provided for the month of December 2015. Previously, APL was exempted from filing quarterly surveillance reports with the Board.
APL’s financial ratios have improved in recent years, indicating greater ability to service debt payments. However, its credit rating was downgraded by DBRS in 2015 after the company signed new contracts with shippers, in part due to the lower shipper credit quality and shorter duration of contracts.
| Alliance Pipeline Ltd. | 2010 | 2011 | 2012 | 2013 | 2014 | 2015 |
|---|---|---|---|---|---|---|
| Deemed Equity Ratio | 30% | 30% | 30% | 30% | 30% | 30%Note a |
| Achieved Return on Equity | 11.26% | 11.26% | 11.26% | 11.26% | 11.26% | - |
| Interest and Fixed-Charges Coverage RatioNote b | 2.25 | 2.21 | 2.29 | 2.41 | 2.58 | 2.75 |
| Cash Flow-to-Total Debt and Equivalents RatioNote b | 16.9% | 18.0% | 18.5% | 21.2% | 22.3% | 27.4% |
| DBRS Credit Rating | A (low) | A (low) | A (low) | A (low) | A (low) | BBB |

- Date modified: