Canada’s Pipeline Transportation System 2016
Montreal Pipe Line Limited’s Montreal Pipe Line
| Commodity and NEB Group | Crude Oil (Group 2) |
| Average Operating capacity | 44 500 m³/d (280 Mb/d) |
| Average utilization 2015 | 22% |
| Primary receipt points | Portland, ME |
| Primary delivery points | Montreal, QC |
| Abandonment Cost Estimate and Collection PeriodNote a | $19.9 million; 40 years |
Overview
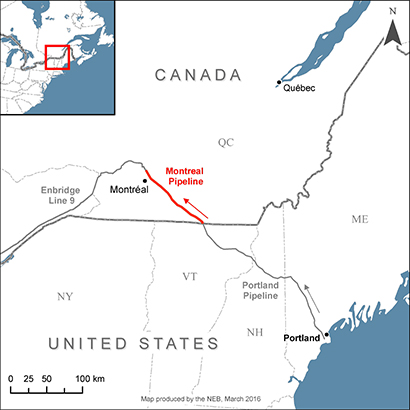
The Montreal Pipe Line is the Canadian portion of the Portland Montreal Pipe Line (PMPL). PMPL is a 380 km pipeline system that transports eastern Canadian and international crude oil from Portland, ME to Suncor’s refinery and Enbridge’s terminal in Montreal, QC. The PMPL system is comprised of three pipelines along the same right-of-way. The largest pipeline (24-inch) is the only line in operation. The other two pipelines (12-inch and 18-inch) were deactivated in 1982 and 2011, respectively.
Source: NEB
Text version of this map
This map provides an overview of the Montreal Pipeline System.
Key Developments
The Montreal Pipe Line reported no throughputs from January to March 2016. In December 2015, the Enbridge Line 9 Expansion and Line 9B Reversal Project came into service, enabling Quebec refiners to access western Canadian and U.S. crude oil supply by that pipeline.
Due to the implementation of the Financial Resource Requirements of the Pipeline Safety Act Regulations, Montreal Pipe Line Limited (MPL) indicated its intention in May 2016 to reduce the capacity of its system to less than 39 700 m³/d (250 Mb/d).
MPL submitted an application to the Board in April 2014 to deactivate its St.-Césaire Pump Station and related facilities. The NEB approved the application in May 2014 and deactivation was completed in December 2014.
MPL received regulatory approval on April 2011 to deactivate its 18-inch pipeline between Highwater and Montreal East, QC and deactivation was completed in December 2011.
Utilization
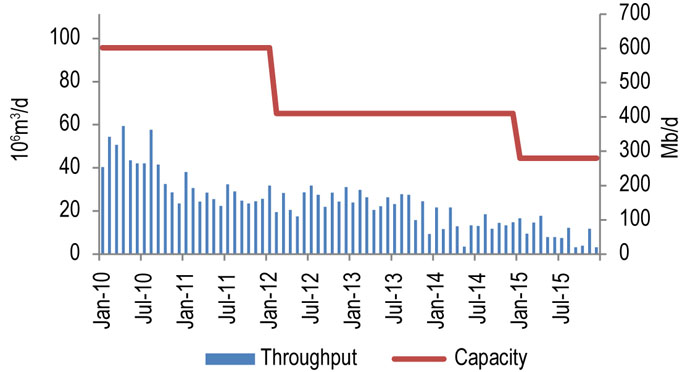
Figure 9.5.1 illustrates Montreal Pipeline throughput and capacity. Throughput has fallen steadily between 2010 and 2015, averaging 14 200 m³/d (89 Mb/d) in 2014 and 9 700 m³/d (61 Mb/d) in 2015.
Figure 9.5.1: Montreal Pipeline Throughput vs. Capacity
Sources: Montreal Pipeline, NEB
Text version of this graphic
This bar chart shows throughput and capacity for the Montreal Pipeline between 2010 and 2015. Capacity in 2015 was 44.5 10³m³/d (280 Mb/d). Throughput averaged 9.7 10³m³/d (61 Mb/d) in 2015, compared to 14.2 10³m³/d (89 Mb/d) in 2014.
Tolls
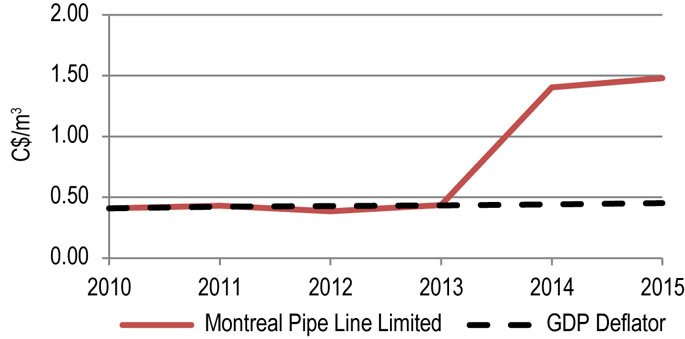
Figure 9.5.2 shows the Montreal Pipeline benchmark toll (transportation from the U.S. border to Montreal East) and the GDP deflator (normalized) for 2010-2015. The sharp increase in tolls between 2013 and 2014 was a result of decreased throughput. Tolls are regulated on a complaint basis.
Figure 9.5.2: Montreal Pipeline Benchmark Toll
Source: NEB
Text version of this graphic
This graph shows the Montreal Pipe Line benchmark toll as a solid red line and the GDP deflator as a black dashed line.The toll remained steady between 2010 and 2013 at approximately $0.40. The toll increased to $1.40 in 2014 and again in 2015 to $1.48.
Financial
Revenue and net income have decreased due to reduced throughput.
| Montreal Pipe Line Ltd. | 2010 | 2011 | 2012 | 2013 | 2014 | 2015 |
|---|---|---|---|---|---|---|
| Revenues (millions) | $77.3 | $71.5 | $71.2 | $64.3 | $49.3 | $38.6 |
| Net Income (millions) | $19.9 | $19.1 | $22.9 | $18.1 | $10.1 | $6.1 |
| Equity (millions) | $38.7 | $51.3 | $74.2 | $90.9 | $101.0 | $107.1 |

- Date modified: