Canada's Renewable Power – Canada

Canada

In 2018, over two-thirds of Canada’s electricity was generated from renewable sources. Wind and solar capacity is projected to continue growing over the medium term, but at a slower pace compared to capacity additions made between 2010 and 2017.
Generation Trends
Canada is a world leader in electricity generation from renewable and non-emittingFootnote 1 sources. In addition to large and abundant hydro resources that have existed for decades, Canada has seen strong growth in non-hydro renewables (primarily wind and solar) over the past decade. Generation from renewable sources is expected to continue increasing as demand for electricity increases and as electricity generation in Canada continues to decarbonize.
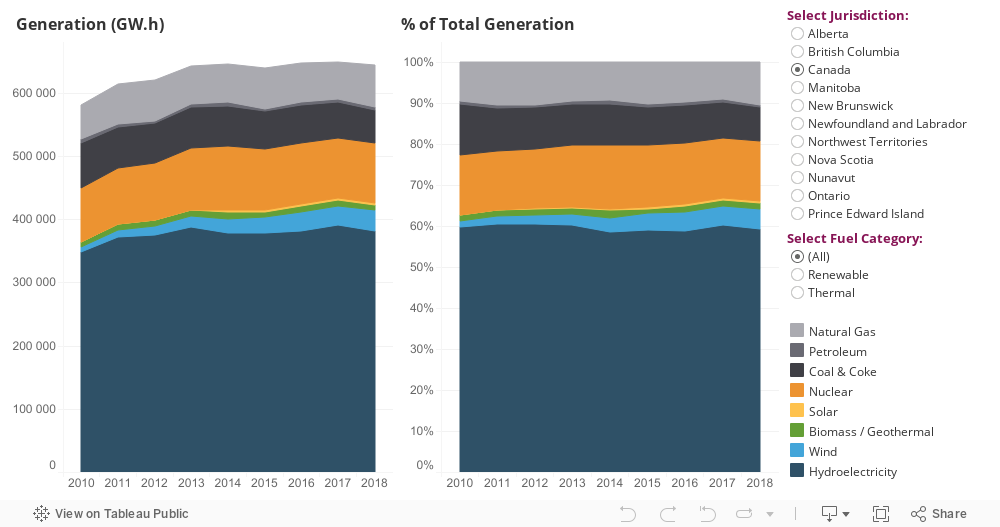
Figure 1 illustrates electricity generation by fuel type in Canada between 2010 and 2018. Figure 1 also illustrates electricity generation by fuel type in each province and territory over the same period.
Figure 1. Electricity Generation by Fuel Type
Source and Description
Source: CER – Canada’s Energy Future 2020 (EF2020)
Description: This graph illustrates historical electricity generation by fuel type in Canada, and in each province or territory. The interactive graph also allows for the option to view generation by renewable or thermal. In 2010, Canada’s total generation was 580 747 GW‧h (62.8% renewable). In 2018, total generation was 643 450 GW‧h (66.2% renewable).
Figure 1 shows that while hydro is the largest source of electricity in Canada (59.4% of total generation in 2018), not every region has adequate or available hydro resources to supply its needs. In Alberta, Saskatchewan, and Nova Scotia, fossil fuels like coal and natural gas form the bulk of electricity generation. In Ontario, nuclear is the largest source of electricity generation.
Figure 1 also shows that between 2010 and 2018, electricity generation from renewable sources in Canada has increased. In 2010, 62.8% of Canada’s total electricity generation (364 681 gigawatt-hours, or GW.h) was from renewable sources. By 2018, 66.2% (425 722 GW.h) was from renewable sources.
Further, between 2010 and 2018, generation from thermal sources (that is, nuclear, coal and coke, natural gas, and petroleum) shrank from 37.2% of total electricity generation (216 066 GW.h) to 33.8% (217 728 GW.h).
Canada’s Electricity Grid
Canada’s electricity grid can be described as “fragmented”. Canada has few connections that link jurisdictions together and most jurisdictions mainly supply electricity to meet their own demand. Where large connections do exist, they primarily connect provinces to the United States (U.S.) and electricity flows north-south. Quebec, Ontario, Manitoba, and British Columbia (B.C.) are notable net exporters of electricity to the U.S. Provinces trade electricity with the U.S., or neighbouring provinces, when they can sell electricity at higher prices in those markets, or buy it at lower prices. Some provinces also need to purchase electricity from neighbouring provinces to meet demand that rises above their ability to supply.
Prince Edward Island (PEI) is the only province that largely relies on electricity production in another province (New Brunswick). With the completion of the Maritime Link transmission line between Newfoundland and Nova Scotia, the island of Newfoundland became connected to the North American grid for the first time, and the purchase of hydroelectricity from Newfoundland and Labrador will reduce coal generation in Nova Scotia. The link could also facilitate more renewable energy development in the region.
None of Canada’s three territories are connected to another province or territory. Nunavut is the only jurisdiction in Canada without an electricity grid – all 25 communities in the territory rely on local diesel generation.
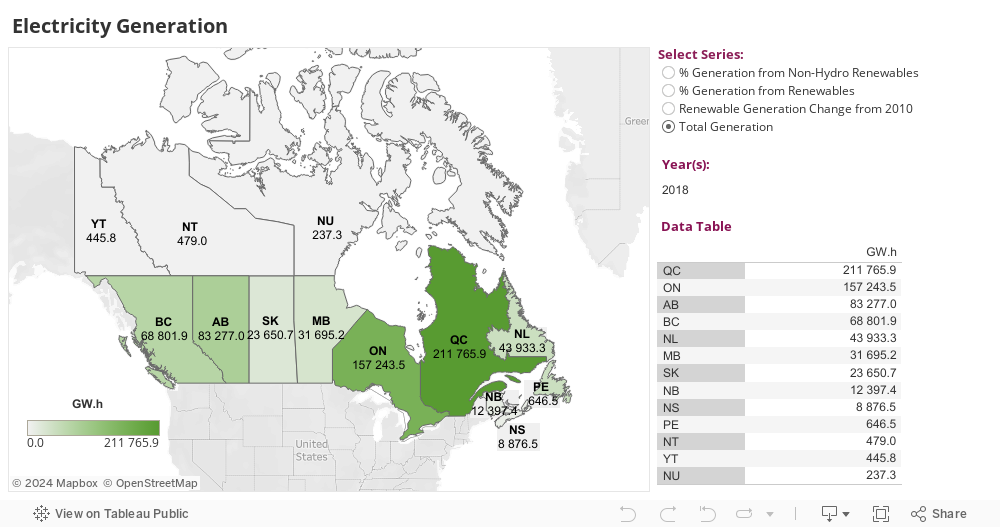
Figure 2 shows total electricity generation in each province and territory in 2018, the percentage generation from renewables in each jurisdiction, and the percentage change in renewable generation in each jurisdiction.
Figure 2. Map of Electricity Generation in Canada
Source and Description
Source: CER – EF2020
Description: This map illustrates electricity generation in each province and territory, measured in GW.h. The interactive features of this map allow the user to select metrics to view, including the percentage of electricity generation in each jurisdiction from non-hydro renewables, the percentage of electricity generation from all renewables, the change in renewable generation between 2010 and 2018 in GW.h, and lastly, total generation in GW.h.
Newfoundland and Labrador, PEI, Quebec, Manitoba, B.C., and Yukon each generate over 95% of their electricity from renewable sources (primarily hydro). The jurisdictions with the highest percentage of non-hydro renewable electricity generation are PEI (100%), Nova Scotia (15.8%), and Ontario (10.5%). For Canada as a whole, generation from non-hydro renewables in 2018 was 6.8% or 43 602 GW.h.
Between 2010 and 2018, several jurisdictions experienced notable growth in electricity generation from renewables. Over this period, Ontario’s generation from renewables grew 51.1%, Alberta’s grew 46.1%, and PEI’s grew 38.7%. For Canada as a whole, generation from renewables grew 16.7% between 2010 and 2018.
GHG Emissions from Electricity Generation
Canada’s electricity sector emitted 69.9 megatonnes of carbon dioxide equivalent (MT of CO2e) of greenhouse gases (GHGs) in 2018, which was 9% of Canada’s total emissions.Footnote 2 GHG emissions from electricity generation have declined 31% since 2010. This is primarily because coal-fired generatin has declined.Footnote 3 Electricity generation from coal in Canada declined from 73 986 GW.h in 2010 to 57 622 GW.h in 2018, resulting in a drop of 34.9 MT of CO2e.
Declining coal-fired generation in Canada has caused the national average generation GHG emissions intensity (as measured in grams of CO2e per kilowatt-hour, or g CO2e per kW.h) to also decline. Average generation intensity declined from 190 g CO2e per kW.h to 120 g CO2e per kW.h between 2010 and 2018.
However, coal-fired generation remains the largest contributor of GHG emissions from electricity at 44.1 MT of CO2e, with natural gas contributing 21.1 MT of CO2e and other fuels (primarily diesel) contributing 4.7 MT of CO2e.
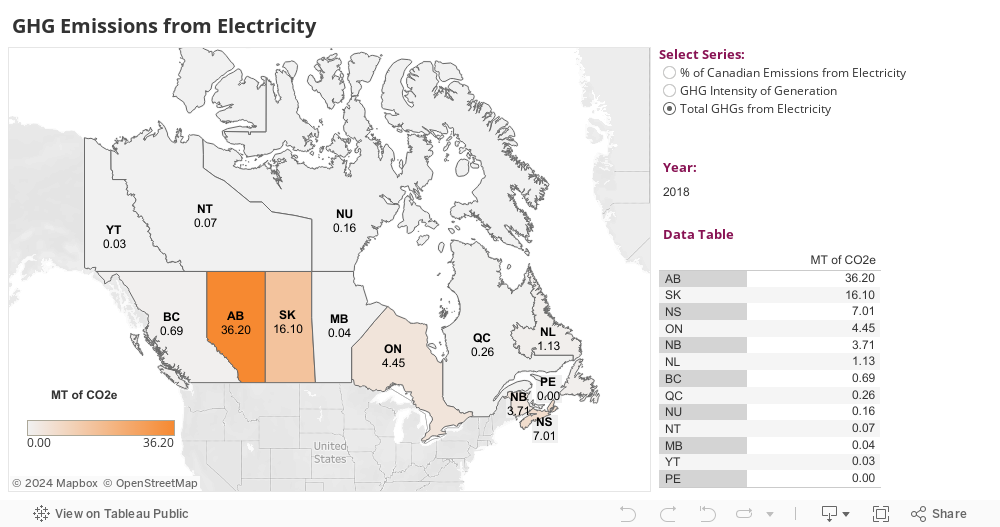
Figure 3. Map of Greenhouse Gas Emissions from Electricity in Canada
Source and Description
Source: ECCC – National Inventory Report 2020, CER calculations
Description: This map illustrates GHG emissions in each province and territory, measured in MT of CO2e. The interactive features of this map allow the user to select metrics to view, including the percentage of total Canadian electricity sector emissions, the GHG intensity of electricity generation (measured in CO2e per kW.h), and total GHGs from electricity generation.
Figure 3 shows GHG emissions from electricity, the percentage of Canadian GHG emissions from electricity, and the generation intensity in each province for 2018. Alberta was the largest province in Canada for emissions from electricity generation at 36.2 MT of CO2e (52% of the national total), followed by Saskatchewan at 16.1 MT of CO2e (23% of the national total), and Nova Scotia at 7.0 MT of CO2e (10% of the national total).
The jurisdiction with the highest generation intensity in 2018 was Nunavut at 840 g CO2e per kW.h. Nunavut’s electricity sector relies entirely on diesel fuel, resulting in Nunavut’s high generation intensity. The jurisdictions with the lowest generation intensity were Quebec and Manitoba at 1.3 g CO2e per kW.h. Both provinces generated virtually all of their electricity from renewable sources (primarily hydro) in 2018.
Recent and Projected Capacity Changes for Renewables
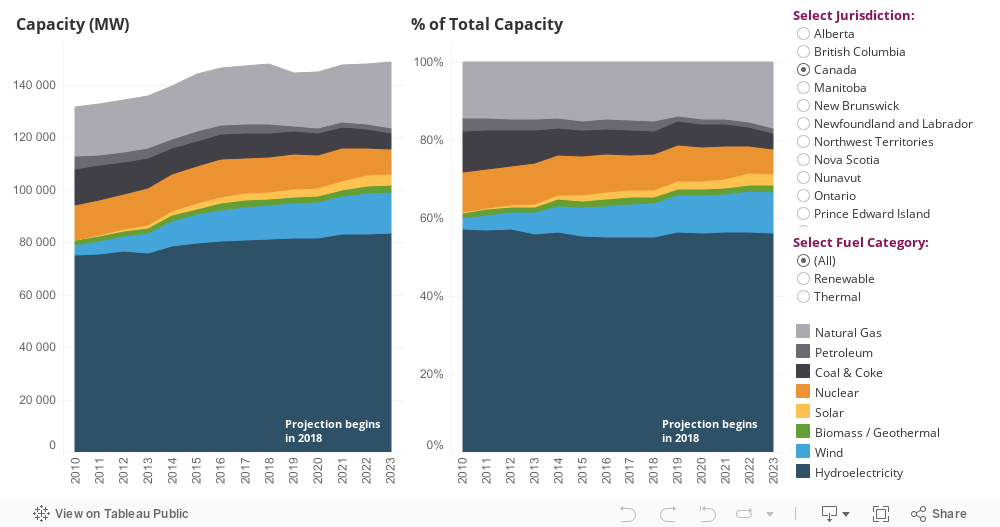
Figure 4 shows historical capacity changes in Canada between 2010 and 2017, and projected capacity changes between 2018 and 2023. Capacity data is displayed in megawatts (MW), and in percentage share of total capacity, by fuel type, in each province and territory over the same periods.
Figure 4. Electricity Capacity by Fuel Type
Source and Description
Source: CER – EF2020
Description: This graph illustrates historical and projected electricity capacity by fuel type in Canada, and in each province or territory. The graph also has the option to choose renewable or thermal generation. In 2010, Canada’s total installed electricity capacity was 131 628 MW (61.5% renewable). In 2017, capacity had grown to 147 167 MW (67.0% renewable). By 2023, total capacity is projected to grow to 148 887 MW (71.2% renewable).
Between 2010 and 2017, the largest capacity additions were in wind (8 927 MW), hydro (5 774 MW), natural gas (3 150 MW), and solar (2 333 MW). Capacity shrank for coal and coke (-4 262 MW) and oil and diesel (-1 014 MW) between 2010 and 2017.
Overall, renewable capacity grew 17 672 MW while thermal capacity shrank by 2 133 MW. Figure 5 shows total renewable (and non-hydro renewable) capacity for each province and territory in Canada, and shows the total change (∆) in each jurisdiction for renewable capacity between 2010 and 2018.
Between 2017 and 2023, the largest capacity additions (in the CER’s Evolving Scenario) are projected for natural gas (3 246 MW), wind (3 178 MW), hydro (2 392 MW), and solar (1 784 MW). Capacity is projected to shrink the most for nuclear (-3 665 MW), coal and coke (-3 638 MW), and oil and diesel (-1 629 MW). The capacity decline for nuclear is partially temporary, with Ontario refurbishing several of its reactors at Bruce and Darlington over the next decade. The retirement of the Pickering Nuclear Generating Station is expected to start in the mid-2020s.
Overall, capacity for renewable sources is projected to grow by 7 407 MW, while capacity for thermal generation is projected to shrink by 5 686 MW. While renewable capacity is projected to continue growing to 2023, the rate of growth (projected at 1.3% per year) is projected to slow when compared to the rate of growth from 2010 to 2017 (2.9% per year).
Data for all generation and capacity numbers are in Table 1.
Figure 5. Renewable Electricity Capacity and Changes Map
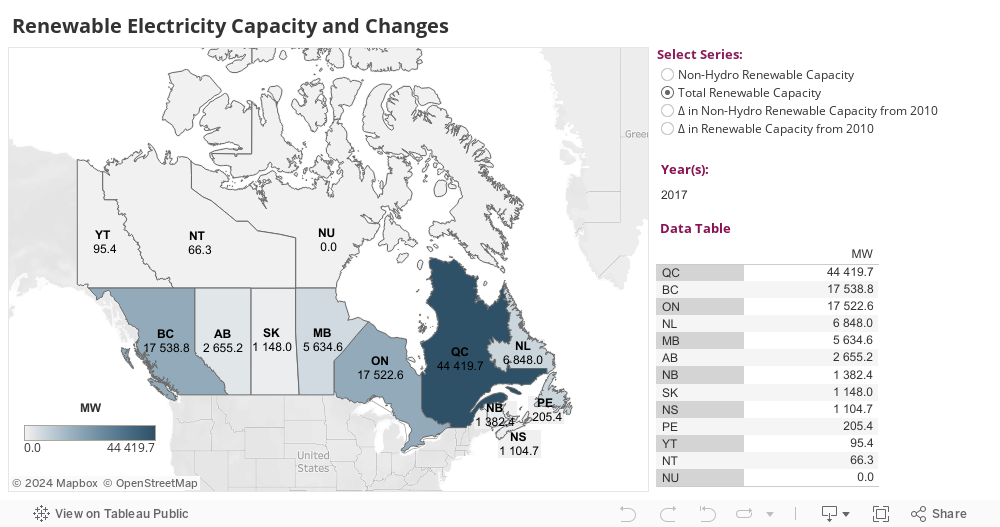
Source and Description
Source: CER – EF2020
Description: This map illustrates renewable electricity capacity and capacity changes for Canada, and in each province and territory. The user can select metrics to view, including non-hydro renewable capacity, total renewable capacity, the change in non-hydro renewable capacity between 2010 and 2018, and the change in total renewable capacity between 2010 and 2018.
Table 1. Electricity Capacity (2010 – 2023) and Generation (2010 and 2018) in Canada
| Capacity in MW and % | Generation in GW.h and % | ||||||
|---|---|---|---|---|---|---|---|
| 2010 | 2017 | 2018 | 2020 | 2023 | 2010 | 2018 | |
| ---------- Projected ---------- | |||||||
| Hydroelectricity | 75 149 | 80 922 | 81 383 | 81 468 | 83 315 | 347 938 | 382 121 |
| 57.1% | 55.0% | 55.1% | 56.2% | 56.0% | 59.9% | 59.4% | |
| Wind | 3 746 | 12 673 | 12 782 | 13 901 | 15 851 | 8 354 | 31 860 |
| 2.8% | 8.6% | 8.6% | 9.6% | 10.6% | 1.4% | 5.0% | |
| Biomass / Geothermal | 1 773 | 2 411 | 2 432 | 2 284 | 2 463 | 8 267 | 8 753 |
| 1.3% | 1.6% | 1.6% | 1.6% | 1.7% | 1.4% | 1.4% | |
| Solar | 281 | 2 614 | 2 720 | 3 028 | 4 398 | 123 | 2 988 |
| 0.2% | 1.8% | 1.8% | 2.1% | 3.0% | 0.0% | 0.5% | |
| All Renewable Sources | 80 949 | 98 621 | 99 317 | 100 681 | 106 027 | 364 681 | 425 722 |
| 61.5% | 67.0% | 67.2% | 69.4% | 71.2% | 62.8% | 66.2% | |
| Nuclear | 13 345 | 13 338 | 13 338 | 12 513 | 9 673 | 85 527 | 95 030 |
| 10.1% | 9.1% | 9.0% | 8.6% | 6.5% | 14.7% | 14.8% | |
| Coal and Coke | 13 780 | 9 517 | 8 929 | 8 522 | 5 880 | 71 259 | 52 646 |
| 10.5% | 6.5% | 6.0% | 5.9% | 3.9% | 12.3% | 8.2% | |
| Natural Gas | 18 946 | 22 096 | 22 566 | 21 342 | 25 342 | 54 093 | 66 120 |
| 14.4% | 15.0% | 15.3% | 14.7% | 17.0% | 9.3% | 10.3% | |
| Oil and Diesel | 4 609 | 3 595 | 3 615 | 2 010 | 1 966 | 5 188 | 3 932 |
| 3.5% | 2.4% | 2.4% | 1.4% | 1.3% | 0.9% | 0.6% | |
| All Thermal Sources | 50 679 | 48 546 | 48 448 | 44 387 | 42 860 | 216 066 | 217 728 |
| 38.5% | 33.0% | 32.8% | 30.6% | 28.8% | 37.2% | 33.8% | |
| All Sources | 131 628 | 147 167 | 147 765 | 145 068 | 148 887 | 580 747 | 643 450 |
- Date modified: